
Why value matters in investing – and what are valuations telling us now?
Why value matters in investing – and what are valuations telling us now?
Key points
– Starting point valuations – like yields and price to earnings ratios – are key drivers of medium-term investment returns.
– Valuation starting points for term deposits and bonds have improved. For shares they suggest constrained return potential, particularly from US shares but Australian, European and Chinese shares are a bit more attractive.
 Introduction
The concept of value or valuation is central to investing as the cheaper you buy an asset the higher its prospective return might be. However, this is frequently forgotten with investors tempted to project recent returns into the future regardless of valuations and periodically – usually after periods of strong gains – some argue that they don’t matter anymore. But looking at value now is pertinent as shares have had a good run and on some measures are stretched – particularly for US shares. For example, a recent Goldman Sachs study concluded that based on current valuations along with various other variables US shares will return around just 3% pa over the next 10 years.
Cash & bonds offer better returns than three yrs ago
By its nature valuation is a relative concept usually expressed relative to the income flow an investment will produce. This makes the valuation of cash and bonds relatively simple but for shares it can get more slippery and for things like gold and Bitcoin it can get really hard as there is no real income. The good news for cash and bonds is that the rise in interest rates since 2022 has improved their valuations as they are now providing more interest income. That said term deposit rates are still well below levels around 6-7% in 2010 and have started to soften ahead of RBA rate cuts.
Bank term deposit rates well up from their lows
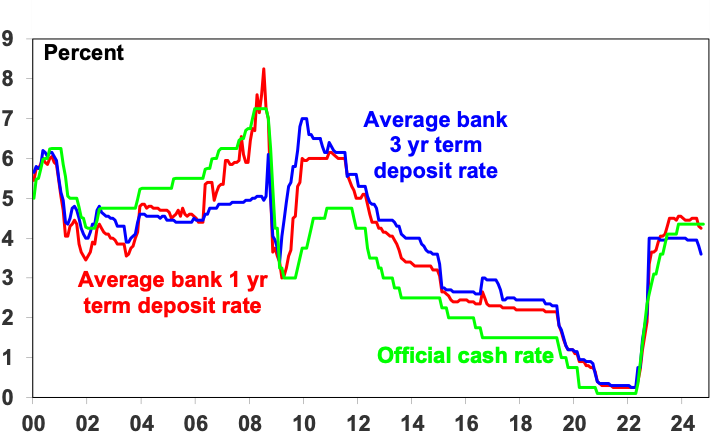
Source: RBA, AMP
For government bonds, their yield is a good guide to starting point value and hence medium-term return potential. If the yield on a 10-year bond is 5%, and you hold the bond to maturity, your return will be 5%. Of course, the relationship is not perfect but it’s a very good guide. This can be seen in the next chart which shows a scatter plot of Australian 10-year bond yields since 1950 (horizontal axis) against subsequent 10 year returns from Australian bonds based on the Composite All Maturities Bond index (vertical axis). When bond yields are low, they set up low bond returns over the medium term and vice versa. For example, at their low point of 0.6% in 2020, 10-year bond yields were pointing to very low returns but they are now 4.5% pointing to better returns, albeit still historically low.
Australia bonds- the higher the bond yield the better the return
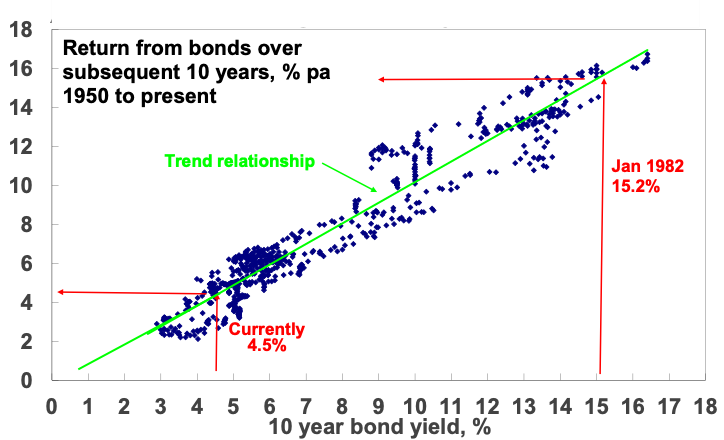
Source: Bloomberg, AMP
For shares, the lower the PE (or the higher the dividend yield) the better
For shares a similar relationship holds. The following chart shows a scatter plot of the price to trailing 12 months earnings ratio for US shares since 1900 (along the horizontal axis) against subsequent 10-year total returns (i.e. dividends plus capital growth) from US shares. While the relationship is not as smooth as for bonds, as share returns are more complicated, it is a negative relationship. So, when share prices are high compared to earnings, subsequent 10-year returns tend to be low and vice versa.
US shares – the lower the PE the better the medium term return
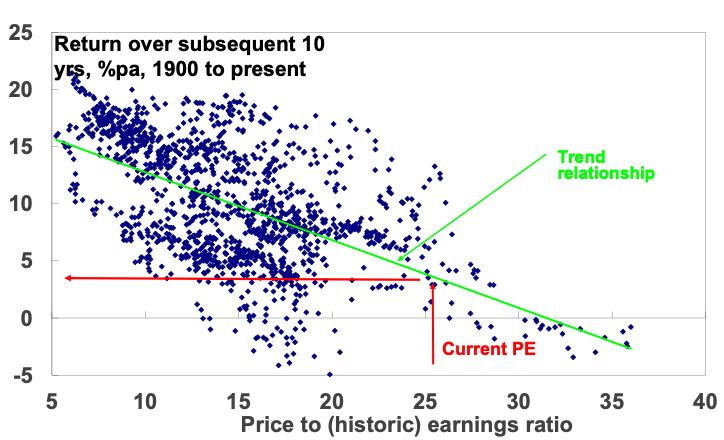
Source: Bloomberg, AMP
The next chart shows the same for Australian shares from 1962, which is as far back as we have PE data for. Again, the relationship is negative between the level of the PE and subsequent total returns (based on the All Ords Accumulation Index) with the best returns coming after periods of low PEs. For example, at the end of the mid-1970s bear market the PE was just 5.4 times and shares returned 21.8% pa over the next decade!
Aust shares – the lower the PE the better the medium term return
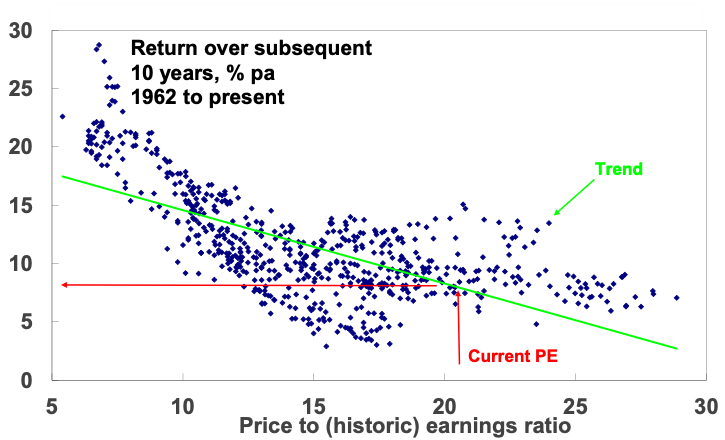
Source: RBA, ASX, AMP Capital
There is dividend yield data for Australian shares from 1900 and as expected the higher it is the better the subsequent 10-year return.
The key is that the starting point value matters a lot – the higher the yield and the lower the PE (for shares) the better for medium term returns. But behavioural finance tells us that it’s natural for investors to pay too much attention to recent performance, so after a run of strong years investors expect it will continue and fear they will miss out (FOMO) if they don’t get in. This leads many to buy only after good times, only to find they have bought when shares are overvalued, and they find themselves locked into poor returns. And vice versa after a run of poor returns.
Valuation is not a perfect guide to share returns
Of course, share market valuations can have their own pitfalls.
- First, you need to allow for risk as sometimes assets are cheap for a reason. This can be an issue with individual shares, e.g. a tobacco company subject to lawsuits even though current earnings are fine.
- Second, valuation is a poor guide to market timing, often being out by years. Eg, many have pointed out over the last few years that US tech shares are overvalued only to see them keep outperforming.
- Third, there is a huge array of valuation measures for shares. For example, the “earnings” in the PE can be actual historic earnings as reported for the last 12 months, consensus earnings for the year ahead or earnings that have been smoothed to remove cyclical distortions. All have pros and cons.
- Finally, the appropriate level of valuation will vary with inflation and interest rates. In times of low inflation, assets can trade on lower yields as the yield structure in the economy falls, uncertainty falls and (for shares) the quality of reported earnings improves. This means higher PEs. The shift from the high inflation and interest rates of the 1970s and 1980s to very low inflation last decade was very positive for shares. But if inflation rises resulting in higher interest rates, this is bad news for shares as we saw in 2022. Fortunately, inflation is now on the way back down again allowing higher PEs.
Current share market valuation signals
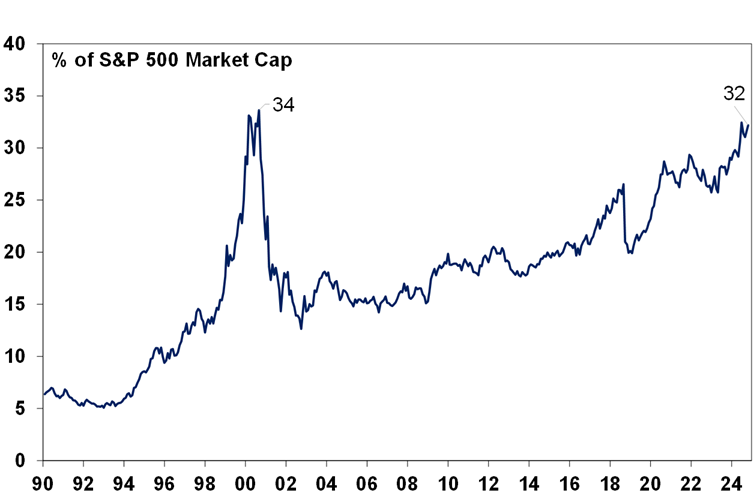
It’s hard to avoid the conclusion that rich valuations point to a period of lower returns over the next decade or so for US shares. This is evident in the relationship between PEs and subsequent share market returns seen in the third chart in this note – with the current US PE of 26 times pointing to an average return over the next decade of around 3% pa – see the red lines on the chart (although there’s been a big range around this). US share market concentration in IT is a concern as the Goldman Sachs analysis pointed out. IT shares are now nearly as big a share of the US market as they were at the tech boom peak in 2000. This is a concern as it’s hard for a handful of stocks to sustain their strong profit performance. That said at least tech stocks are earning strong profits now – with Nasdaq on a 41 times PE versus around 100 in early 2000.
Information Techology shares in the S&P 500
Source: Bloomberg, AMP
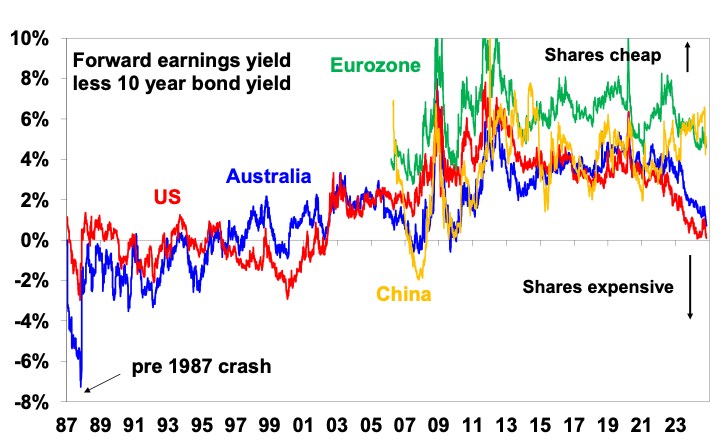
Similarly, the risk premium the US share market offers over bonds – derived by subtracting the 10-year bond yield from the earnings yield (using forward earnings) – is now zero, which is well below the 3 to 4% offered over much of the period since the GFC.
Equity risk premium over bonds
Source: Bloomberg, AMP
Fortunately, valuations for other share markets are not as stretched:
- Australian shares are trading on a PE of 21 times which based on the historic relationship with returns seen in the fourth chart in this note points to a medium-term return of around 8% pa. That said, like the US it offers a relatively low risk premium over bonds (see chart above)
- Eurozone shares are trading on a PE of around 15 times and offer a 4.6% risk premium over German bonds (see chart above).
- Chinese shares are trading on a PE of around 16 times (and lower depending on the index used) and provide a relatively high risk premium over bonds (see chart above).
Implications for investors
Stretched US market valuations have several implications for investors.
First, they leave shares vulnerable to a fall particularly given that the risk of recession still remains high, the expansion of the war in the Middle East still threatens to impact oil supplies (although Israel’s “restrained” response to Iran’s missile attack points to de-escalation for now) and a Trump victory in the US election will likely spark another trade war.
Second, it provides a reminder that share market returns won’t be sustained at double digit levels indefinitely.
Third, given the relatively stretched nature of the US share market and tech stocks in particular there is a case to consider a reduced allocation to US shares in global share portfolios.
Finally, it’s worth bearing in mind that timing this is likely to be hard. Worries about the US share market’s dependence on tech stocks are not new and they have kept going for longer than many thought.
Our view remains positive for shares on a six to 12 month view as central banks cut rates and recession is avoided, but stretched valuations in the key US share market point to more constrained returns with higher risk.
Dr Shane Oliver – Head of Investment Strategy and Chief Economist, AMP
Important note: While every care has been taken in the preparation of this document, AMP Capital Investors Limited (ABN 59 001 777 591, AFSL 232497) and AMP Capital Funds Management Limited (ABN 15 159 557 721, AFSL 426455) make no representations or warranties as to the accuracy or completeness of any statement in it including, without limitation, any forecasts. Past performance is not a reliable indicator of future performance. This document has been prepared for the purpose of providing general information, without taking account of any particular investor’s objectives, financial situation or needs. An investor should, before making any investment decisions, consider the appropriateness of the information in this document, and seek professional advice, having regard to the investor’s objectives, financial situation and needs. This document is solely for the use of the party to whom it is provided.