
What we’re watching as markets try and normalise
What we’re watching as markets try and normalise
We’re past the halfway point of a year that has marked a profound chapter in modern history. This time last year, the events of the last six months would have been unimaginable. This time a few months ago, there was no end in clear sight. Now, it’s hard to believe we’re this far through the year.

Realising all this is a reminder to us all that time and traumas will always pass, no matter how much the noise of the information age could tempt you to believe otherwise.
The same is true of markets. Though we can’t understate the impact of COVID-19 – it is severe and widespread – markets have always fought to normalise, and they’re doing that now.
For example, share markets around the world have produced some of their biggest rallies since their COVID-19 lows. This includes the US share market, which leads big moves in global markets, hitting a new recovery high in early June by ~45% from its low on 23 March. Countries around the world are at different stages of in terms of controlling the virus, management and recovery – averaging global numbers doesn’t give a true indication of what’s happening in different investment markets.
However, there are signposts which, worldwide, serve as a progress tracker. We’re keeping an eye on these as the pandemic runs its course, and we learn to live with COVID-19 until a vaccine is found.
We have been monitoring these signposts, we believe they are signs that a nation has got a handle on the pandemic, serving as promising milestones for economic and investment market recovery:
-
Control of the virus.
-
Policy support from government.
-
Collateral damage has been kept to a minimum.
-
Signs of a technical market bottom.
Here, we explain what this looks like in more detail.
Control of the virus
The speed at which communities can effectively control the spread of infection is an important signpost of how quickly economies can re-open and resume normal business activity.
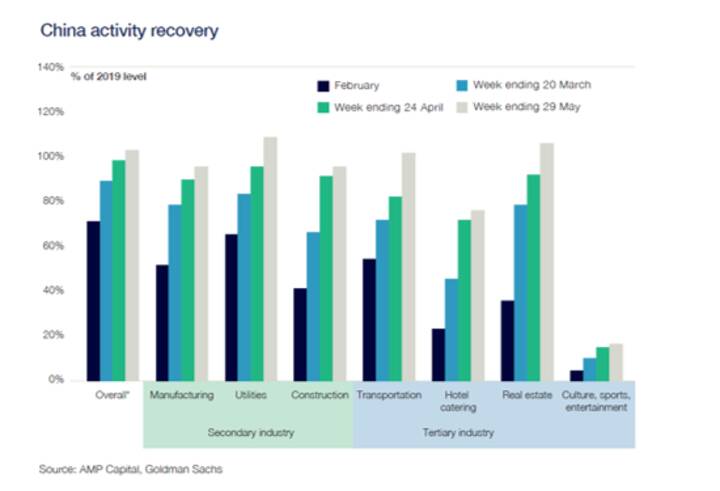
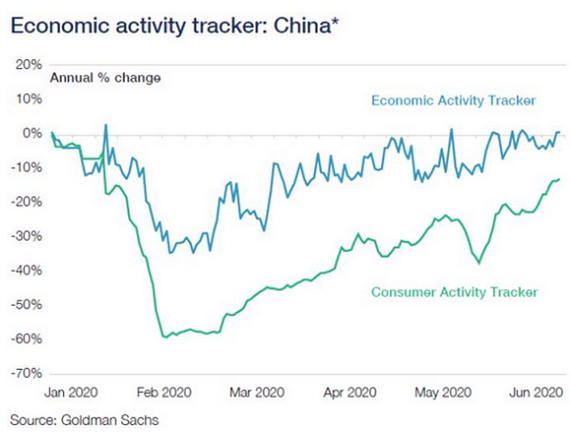
China was the first country to go through, and start to emerge, from the pandemic. Signs of infection control was an early indicator for the government of when it was safe to resume domestic activity, which has picked up since. GDP took a dive in the first quarter – a fall of 9.8%. However, the Chinese economy has shown a marked recovery since, which you can see in the chart below.
As another example, Australia and New Zealand’s success in virus control – the best in the OECD – is also promising for domestic economies. Both nations have started re-opening the economies, and share markets have rallied in response. For example, in late May, the Aussie share market was about 29% higher than its low point on 23 March, which was preceded by a 37% decline. By late June, the market was up ~27% since its low point.
Policy support from governments
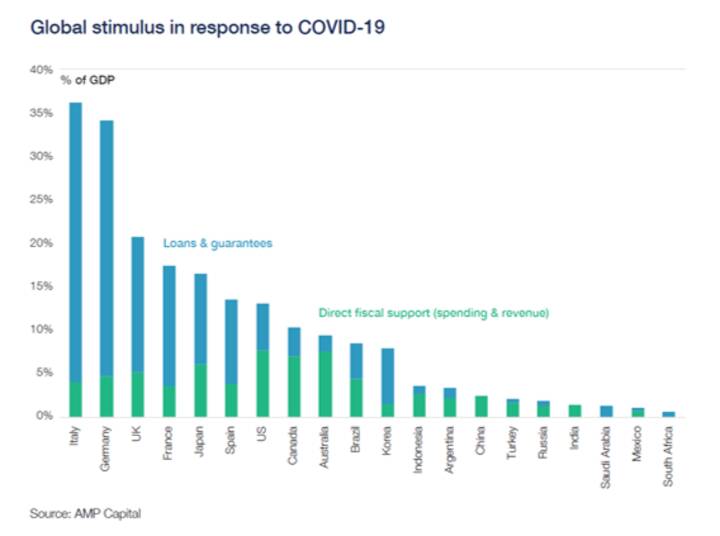
One of the world’s biggest learnings from the Great Depression was how critical the role, type and timing of stimulus is for economic recovery. Though it may seem counterintuitive to spend big when cash is tight, history tells us that keeping money flowing through the economy gives us a far better chance of avoiding a depression than raising revenue through taxes to keep budgets balanced or keeping money in the bank.
The level of stimulus worldwide has been substantial, as evidenced on the right. Even more so when you consider the level of direct spending countries like the US, Australia and Canada have injected into the economy.
During the Great Depression, precisely the opposite happened – there was monetary and fiscal tightening, with tax rates raised and spending cut. This contributed to the severity of the depression.
So, we have learnt the question is not just ‘can we afford all this spending?’ It is also ‘can we afford to not spend?’
Collateral damage is kept to a minimum
For an event to be a disruption to economic activity, rather than a prolonged drag, you want to see that sectors and confidence have not sustained irreparable damage, giving promise of spending and activity patterns recovering and normalising.
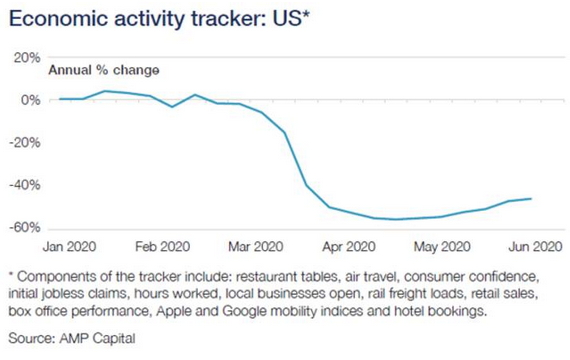
There are already signs of life in major economies like the US, where high frequency data continues to indicate that economic activity has likely hit the bottom.
The risk, of course, is that the surge in new US cases will see some roll-back in the reopening of the economy. Our weekly economic activity trackers for the US are based on things like restaurant bookings, confidence, retail foot traffic, box office takings, hotel bookings, credit card data, mobility indexes and jobs data. So far, it looks as though they hit the bottom in mid-April.
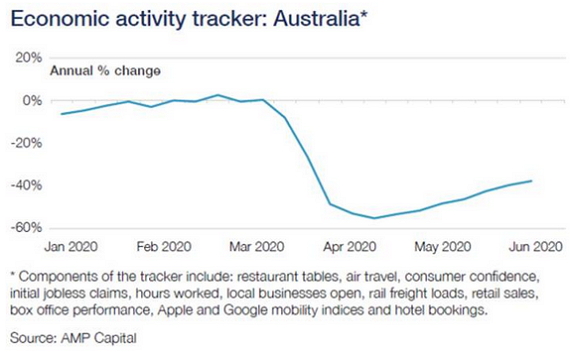
In countries like Australia, where virus control has been world-leading and economies are re-opening sooner than originally thought as a result, signs of recovery in high-frequency data are even stronger.
As mentioned earlier, China is a couple of months ahead of the rest of the world, and its patterns indicate that activity is picking up, overcoming the collateral damage first caused by widespread shutdowns.
Technical signs of a market bottom
Trying to time the bottom of the market is incredibly difficult to predict. However, there are some hallmark signals that markets may have reach their low point. They include:
-
Extreme oversold conditions, which we saw in March.
-
Apocalyptic investor sentiment, the old ‘buy when there is blood on the streets’ expression springs to mind here, representing the lowest point of the market.
-
Signs that downwards momentum is falling, and less stocks are marking new lows.
While in some countries you could say markets have reached their bottom, it’s important to note that some threats still remain.
A second wave of COVID-19 cases is one of those risks, particularly in places like the United States, where the number of new cases remains high, and success at controlling the virus across different states is mixed.
There are also simmering geo-political tensions between China and the US, which have re-ignited the trade frictions and stand-offs we saw last year.
Author: Diana Mousina, Economist – Investment Strategy & Dynamic Markets, Sydney Australia
Source: AMP Capital 17 June 2020
Reproduced with the permission of the AMP Capital. This article was originally published at AMP Capital
Important note: While every care has been taken in the preparation of this document, AMP Capital Investors Limited (ABN 59 001 777 591, AFSL 232497) (AMP Capital) makes no representation or warranty as to the accuracy or completeness of any statement in it including, without limitation, any forecasts. Past performance is not a reliable indicator of future performance. This document has been prepared for the purpose of providing general information, without taking account of any particular investor’s objectives, financial situation or needs. An investor should, before making any investment decisions, consider the appropriateness of the information in this document, and seek professional advice, having regard to the investor’s objectives, financial situation and needs. This document is solely for the use of the party to whom it is provided and must not be provided to any other person or entity without the express written consent of AMP Capital.