
Follow the earnings to superior returns in small caps
Follow the earnings to superior returns in small caps
Investors may be surprised to learn about the patterns which have formed in the small caps market since the Global Financial Crisis. Here, we take a closer look at recent data, and what is driving earnings and valuations.

Overview
Australian small cap stocks have failed to live up to their potential in recent times. By definition, small cap companies are generally at an earlier stage of their life cycle with good growth opportunities ahead, and in an environment of record low interest rates and freely available money for companies to expand their operations, it would be expected that they are growing strongly and generating good returns. Some are doing just that, however it may surprise investors that the aggregate level of earnings generated by companies in the ASX Small Ordinaries Index has consistently declined since 2008 when the Global Financial Crisis (GFC) hit.
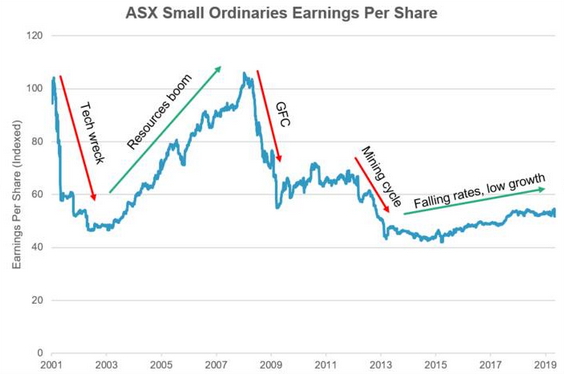
Source: AMP Capital, FactSet (2001-2019)
Earnings under pressure
There have been a few different factors driving the underperformance of earnings:
-
The end of the resources capex boom in 2012-13 resulted in large earnings downgrades in mining and mining services related stocks, which were significant components of the index at the time.
-
The domestic environment has been challenging for large parts of the economy with cyclical and structural factors affecting the earnings base of both consumer (subdued consumer confidence, e-commerce) and housing (new start declines, rising power prices) related companies.
-
A number of technology and other high growth stocks have gone through a significant cost investment program – investing heavily in sales, marketing, product development and offshore growth to capitalise on new market opportunities. This has the potential to raise the earnings profile in outer years but has resulted in downgraded earnings forecasts in the near term.
The overall market has delivered muted growth since 2014, which has reflected a stronger period of earnings growth in mining companies (notably gold stocks), while earnings for industrial companies have flat lined and are virtually unchanged since post-GFC lows 10 years ago.
Small caps versus large caps
The factors highlighted above go a long way to explaining the underperformance of small caps stocks compared to their large cap counterparts over this time period. In fact, since small cap earnings bottomed after the GFC in September 2009, the Small Ordinaries Accumulation Index has underperformed the ASX 200 Accumulation Index by 70% in aggregate. It’s interesting that an index dominated by banks and diversified miners has substantially outperformed an index which has contained material exposure to stocks which have captured investor’s attention over the past few years including technology, Chinese consumer consumption (e.g. infant formula and vitamins), electric vehicles and gold.
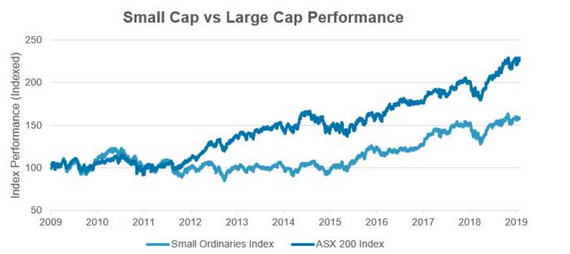
Source: AMP Capital, FactSet (2009-2019)
Follow the earnings
The research we have undertaken into small cap returns and our experience in the market shows that earnings drive share prices. Valuation is an important consideration, however it is mean reverting and hard to predict, so we focus on our core strength – forecasting earnings. An earnings-based approach to valuing a stock is resilient to valuation changes and its serially correlated nature makes it more predictable.
Since 2001, the ability to pick a portfolio of stocks that has actually delivered the highest level of earnings growth in the small caps market would have delivered a compound 14% annual return, or a cumulative return of 828% over this period. This compares to an index return of 1% per annum. Obviously forecasting earnings with perfect foresight is impossible, but this illustrates the potential opportunity for active managers in the space who can spend time undertaking detailed fundamental research on a company and get an edge on the market.
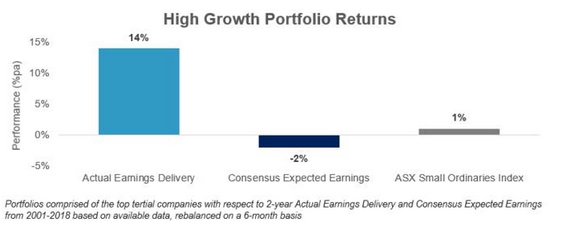
Source: AMP Capital, FactSet
The above chart also shows that sell side analysts have added very little value when picking earnings over this period and investing by following consensus earnings leads to underperformance. In fact, since 2001 a portfolio of small cap stocks with the highest growth forecast by consensus has provided a return of -2% per annum, or -29% in aggregate. This isn’t a huge surprise given sell-side analyst forecasts are typically a lagging indicator. This is further exacerbated by the number and quality of earnings estimates in the Australian small cap market falling dramatically over the past few years.
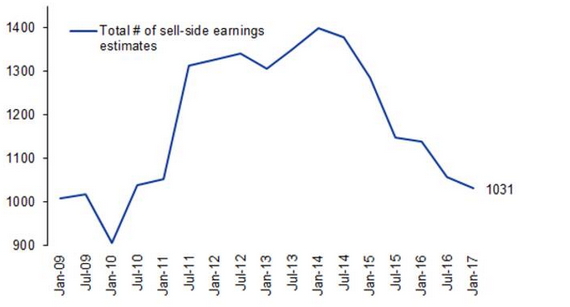
Source: Goldman Sachs Global Investment Research, Factset
When analysing performance of the AMP Capital Australian Emerging Companies Fund since its inception in July 2014 to September 2019, the Small Ordinaries Index has been a solid performer despite the earnings headwinds, providing investors with a 8.9% per annum compound return (55.9% cumulative return). But when we dig into what has been driving this return, it’s clear this performance has been by dividends with muted earnings growth and a P/E multiple re-rate (or put simply, the stocks becoming more expensive). In a world of record low interest rates and rising asset values, the multiple re-rate is understandable and not out of sync with other asset classes, however it is unlikely to be sustainable unless investors start to see material earnings growth starting to come through in order to justify the higher valuations.
The AMP Capital Australian Emerging Companies Fund has returned 11.5% per annum (after-fees) over the same period (76.8% cumulative return), with earnings growth contributing the majority of returns, which is aligned to our investment philosophy and process. The ability to pick stocks which are growing earnings consistently has been the major driver of the Fund’s outperformance.
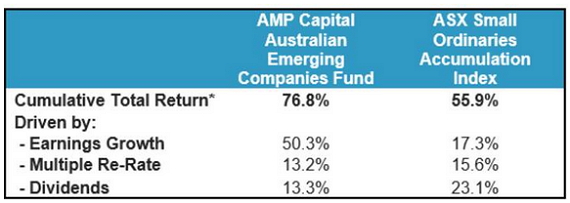
Past performance is not a reliable indicator of future performance Cumulative total returns from July 2014 to September 2019 are shown after fees and before tax
Bigger is better? Not necessarily…
Despite the relatively gloomy picture we have presented for small cap earnings, there is one major reason for optimism in small caps. The median small cap manager has significantly outperformed not only the ASX Small Ordinaries Index, but also the ASX 200 Index and the median large cap manager over a long time period. Investors who have trusted their money with even a middle of the pack small cap manager have seen excellent compound returns over this period. The Australian small caps market is inefficient and not well researched, providing good managers with the opportunity to find new information which gives them an edge in picking stocks.
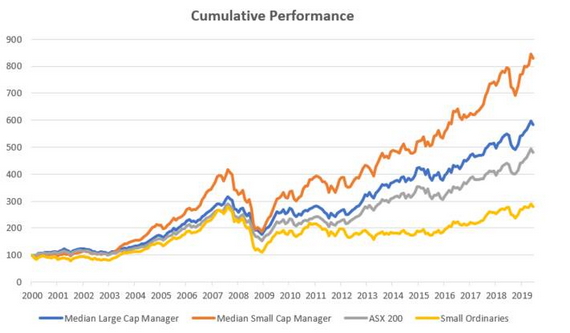
Source: AMP Capital, Mercer, FactSet (2000-2019)
Key take-aways:
-
An investment process which is focused on earnings can lead to significant outperformance.
-
The need for investors to be benchmark unaware – why invest in a stock just because it is in an index? It’s much better to construct a high-quality portfolio of stocks from all the available options in the investable universe.
-
The benefit of active management, especially in small caps, which have proven to generate excellent returns for investors over the long term.
Author: Matt Griffin, Co-portfolio Manager, Small Caps Sydney, Australia
Source: AMP Capital 8th Nov 2019
Important notes: AMP Capital Funds Management Limited (ABN 15 159 557 721, AFSL 426455) (AMPCFM) is the responsible entity of the AMP Capital Australian Emerging Companies Fund (Fund) and the issuer of the units in the Fund. To invest in the Fund, investors will need to obtain the current Product Disclosure Statement (PDS) from AMP Capital Investors Limited (ABN 59 001 777 591, AFSL 232 497) (AMP Capital). The PDS contains important information about investing in the Fund and it is important that investors read the PDS before making a decision about whether to acquire, or continue to hold or dispose of units in the Fund. Neither AMP Capital, AMPCFM nor any other company in the AMP Group guarantees the repayment of capital or the performance of any product or any particular rate of return referred to in this document. Past performance is not a reliable indicator of future performance. While every care has been taken in the preparation of this document, AMP Capital makes no representation or warranty as to the accuracy or completeness of any statement in it including without limitation, any forecasts. This document has been prepared for the purpose of providing general information, without taking account of any particular investor’s objectives, financial situation or needs. Investors should, before making any investment decisions, consider the appropriateness of the information in this document, and seek professional advice, having regard to their objectives, financial situation and needs. This document is solely for the use of the party to whom it is provided and must not be provided to any other person or entity without the express written consent of AMP Capital.